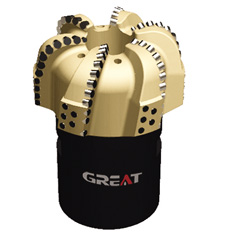
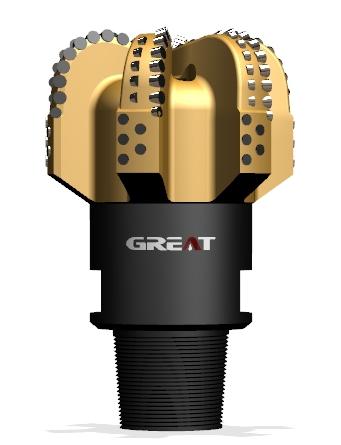
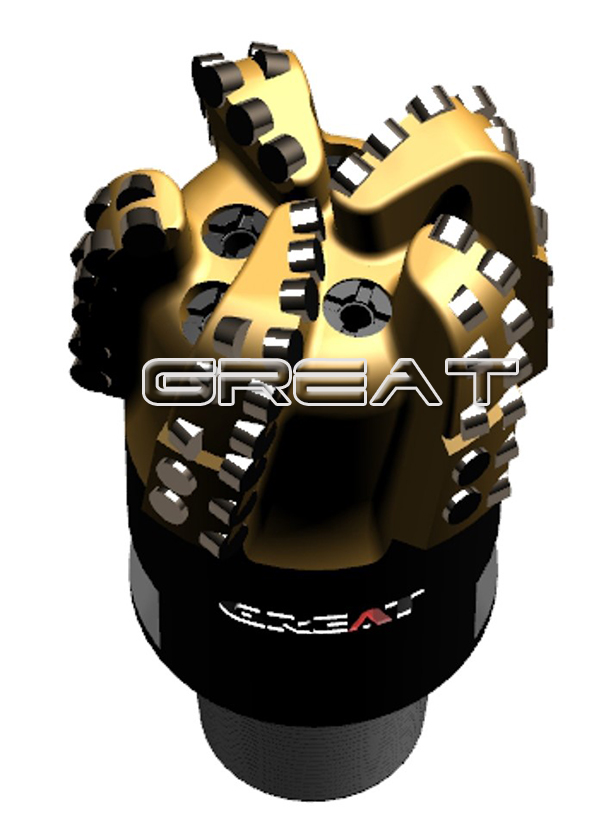
PDC bit selection depends on matching cutter size, shape, back rake, blade count, and hydraulic design to formation hardness and abrasivity. For soft, clay-rich formations, use large cutters with low back rake and few blades. For hard, abrasive rock, choose smaller cutters, more blades, and wear-resistant cutters. This guide provides a formation-by-formation selection matrix for B2B integrators.
Integrators often need a reliable method to choose the right PDC bit without running full-scale lab tests. The wrong bit can cause vibrations, low rate of penetration (ROP), and early failure. According to OnePetro, the oil and gas industry publishes extensive research on PDC bit selection, demonstrating its impact on drilling performance. This article distills that research into a practical comparison framework.

What Are the Key Rock Properties That Influence PDC Bit Selection?
Two rock properties primarily guide PDC bit design: unconfined compressive strength (UCS) and abrasivity. UCS measures rock strength under no confinement, usually in psi or MPa. Abrasivity describes how quickly a rock wears cutters, typically measured with the Cerchar abrasivity index (CAI).
High UCS requires impact-resistant cutters and a robust balance of blades and cutters. High abrasivity demands wear-resistant cutter grades and thicker diamonds. Low UCS allows aggressive geometries with fewer blades and larger cutters. Table 1 lists typical formation classes and their property ranges.
| Formation Class | UCS (psi) | CAI | Example Rock Types |
|---|
| Soft | 0–5,000 | <1 | Clay, shale, sand |
| Medium | 5,000–15,000 | 1–3 | Limestone, siltstone |
| Hard | 15,000–30,000 | 3–5 | Dolomite, granite |
| Very Hard/Abrasive | >30,000 | >5 | Quartzite, basalt |
Table 1 – Typical formation classes and rock properties. Values are illustrative and require confirmation by a subject-matter expert.
According to Halliburton, PDC bits are designed to handle a wide spectrum of formations. A practical selection process starts by identifying the formation’s UCS and CAI. Then, the bit design features can be matched to these values.
How Does Cutter Size Affect PDC Bit Performance?
PDC cutters are made of polycrystalline diamond compact (PDC) bonded to a tungsten carbide substrate. Cutter diameter is a key design variable. Common diameters include 9 mm, 11 mm, 13 mm, 16 mm, and 19 mm. Larger cutters remove more rock per revolution, improving ROP in soft formations. Smaller cutters create lower contact stress, which helps in harder rock.
Table 2 provides a general comparison of cutter sizes and their typical suitability across formations. Exact values depend on bit type and drilling environment.
| Cutter Diameter (mm) | Soft/Medium | Hard | Abrasive |
|---|
| 13 | Good | Good | Fair |
| 16 | Better | Good | Good |
| 19 | Best | Fair | Poor |
Table 2 – Typical cutter-size suitability. The 19-mm cutter provides higher ROP in soft clay, while the 13-mm cutter performs better in hard rock.
As a rule of thumb, a 19-mm cutter has significantly more cutting area than a 13-mm cutter. This increases contact area and, in soft formations, can improve ROP by a factor of 1.5–2.0. For hard and abrasive formations, a 13-mm cutter is often preferred because it generates lower impact load per cutter.
How Does Cutter Shape and Back Rake Impact Wear and ROP?
Cutter shape also plays a critical role. Standard circular cutters are common, but shaped cutters (e.g., chisel, axe) are used for specific applications. A negative back rake angle improves durability but reduces cutting efficiency. A higher back rake angle (more negative) is common for hard rock, while a lower back rake (or less negative) is common for soft rock.
| Back Rake Angle (degrees) | Soft | Medium | Hard | Abrasive |
|---|
| 10–15 | Recommended | Fair | Poor | Poor |
| 15–20 | Good | Recommended | Fair | Fair |
| 20–25 | Poor | Good | Recommended | Good |
| 25–30 | Poor | Fair | Good | Recommended |
Table 3 – Impact of back rake angle on formation suitability. These are typical ranges and require validation.
In high-abrasivity formations, a more negative back rake protects the cutter edge from chipping. However, this also reduces the bit’s aggressiveness. Baker Hughes emphasizes that cutter design, including shape and angle, is critical to balancing ROP and durability.
How Do Blade Count and Hydraulic Design Control Cleanability?
Blade count affects cutter density, junk slot area, and bit stability. High blade counts increase durability but reduce junk slot area, limiting cuttings removal. Low blade counts improve hydraulics but reduce cutter redundancy. Nozzle size and positioning determine bottom-hole cleaning. A proper balance maintains cutting efficiency.
| Blade Count | Soft | Medium | Hard | Abrasive |
|---|
| 5–6 | Excellent | Good | Fair | Poor |
| 6–7 | Good | Excellent | Good | Moderate |
| 7–8 | Fair | Good | Excellent | Good |
| 8–10 | Poor | Fair | Good | Excellent |
Table 4 – Blade count suitability per formation. Higher blade counts enhance durability but may reduce hydraulic efficiency.
Hydraulic design directly impacts bit cleaning and cooling. In soft, sticky formations, high flow rates and large nozzles help prevent balling. In hard rock, focused hydraulic energy can improve ROP. Every bit design must consider the fluid properties and circulation rate available at the rig.
Which PDC Bit Configuration Should You Use for Each Formation?
Combining the preceding factors gives a first-pass selection matrix. Table 5 maps formation types to recommended cutter size, back rake, blade count, and hydraulic design. This matrix is a starting point for system integrators; it must be validated with a bit vendor.
| Formation Type | Cutter Size (mm) | Back Rake (deg) | Blade Count | Hydraulic Design |
|---|
| Soft | 19 | 10–15 | 5–6 | High flow, large nozzles |
| Medium | 16 | 15–20 | 6–7 | Balanced |
| Hard | 13 or 16 | 20–25 | 7–8 | Lower flow, wear-resistant cutters |
| Very Hard/Abrasive | 11 or 13 | 25–30 | 8–10 | High blade count, controlled flow |
Table 5 – Formation-to-feature selection matrix. All values are illustrative and require SME confirmation.
This matrix reflects the general trade-offs described in provider documentation. Halliburton and Baker Hughes offer bit design databases and engineering support to refine these selections.
How to Use This Selection Matrix in Your Drilling Project?
System integrators should follow a structured workflow. First, determine formation lithology and estimate UCS from logs or core data. Second, assess abrasivity using CAI or offset bit records. Third, choose an initial bit configuration from Table 5. Fourth, validate the selection with the bit vendor’s engineering model. Fifth, optimize based on real-time drilling data and offset performance.
The selection process is iterative. Drilling parameters such as weight on bit (WOB), revolutions per minute (RPM), and mud flow rate directly affect bit performance. A configuration that works in one well may need adjustment in another, even in the same formation.
What Are the Limitations of a Simple Matrix Approach?
The matrix approach simplifies a complex engineering problem. Real formations are heterogeneous, and lateral variations can be significant. Downhole vibrations, dull-bit condition, and drilling fluid composition all influence bit life. No single table can replace a thorough bit design evaluation.
The oil and gas industry has published many studies on PDC bit selection. A search on OnePetro returns dozens of peer-reviewed papers, underscoring the need for a data-backed approach. Bit vendors offer simulation tools and field experts who can adapt the matrix to specific wells.
In summary, selecting the optimum PDC bit requires matching cutter size, back rake, blade count, and hydraulics to the formation’s UCS and abrasivity. Use Table 5 as a starting point, confirm the values with a bit vendor, and apply engineering judgment. This evidence-based process will reduce drilling cost and improve ROP.
 English
 français
 Deutsch
 Español
 italiano
 русский
 português
 العربية
 tiếng việt
 ไทย
ไทย Nederland